Follow the power sequence
Select detection, classification, power-up, operation or removal to inspect that part of the run. See source type, assigned class and delivered power when the captured inputs establish them.
Control Hub bench
Observe power delivery between a PoE source and powered device. Follow detection and classification through power-up, operation and removal, with voltage, current and power on the same timeline.
One oscilloscope + Ethernet / PoE Tap
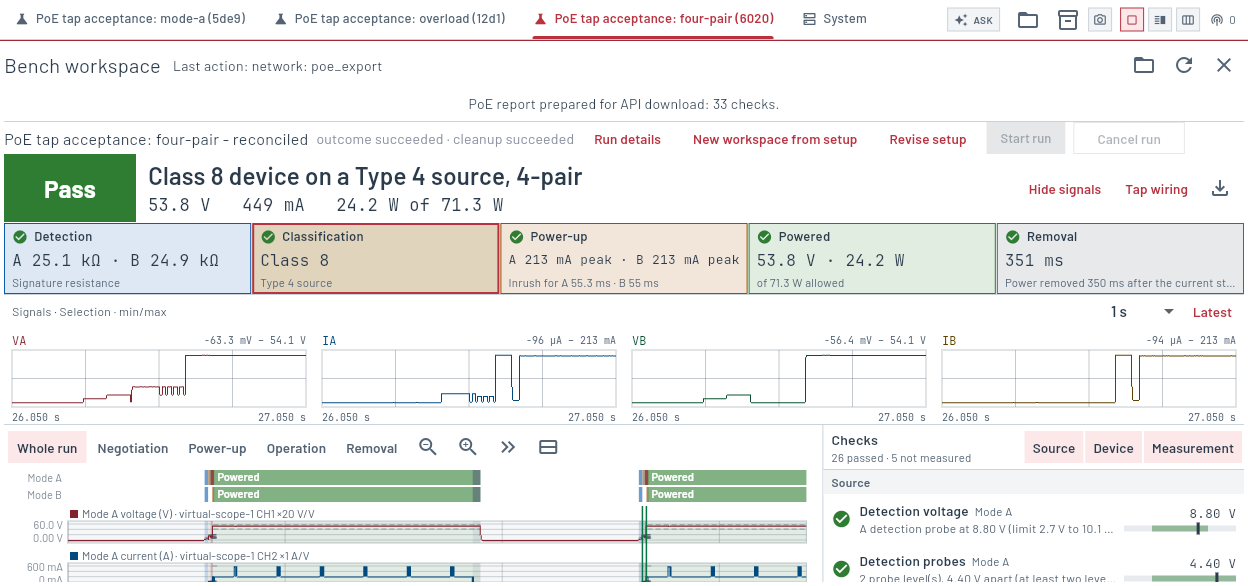 Control Hub · Emulated four-pair PoE session
Detection, classification, inrush, operating power and removal from the Ethernet / PoE Tap’s voltage and current outputs.
Select detection, classification, power-up, operation or removal to inspect that part of the run. See source type, assigned class and delivered power when the captured inputs establish them.
View Mode A and Mode B voltage and current, with combined power for four-pair operation. Inspect inrush, operating levels, ripple and energy over the recorded interval.
Find repeated detection attempts, low port voltage, overload and power removal. Checks are grouped by source, powered device and measurement, with links to the relevant interval.
Captured in the application. Select a view to inspect its controls and results.
Actual Control Hub screenshots using emulated instruments.
Use the Ethernet / PoE Tap and one oscilloscope. Start with one voltage channel; add its current channel for class and power analysis. Use four channels to observe both pair groups together.
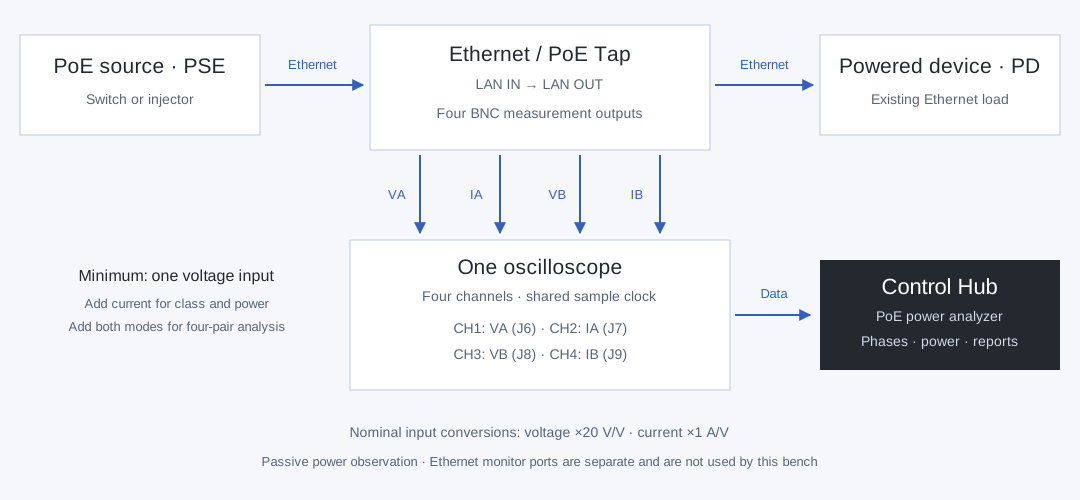
Voltage across pairs 1–2 and 3–6, plus the Mode A current signal. Bind these to two separate scope channels.
Voltage across pairs 4–5 and 7–8, plus the Mode B current signal. Add these channels for four-pair measurements.
Nominal tap scales are 50 mV/V for voltage and 1 V/A for current. The bench uses 20 V/V and 1 A/V conversions; saved setups retain gain and offset corrections.
Measurements and analysis available in the PoE workspace.
| Capability | Implemented software coverage |
|---|---|
| PoE phases | Detection probes, classification and mark events, power-up and inrush, powered operation, overload and removal. |
| Classification | Source types 1–4 and assigned classes 0–8 from observed physical classification. Mode A, Mode B and four-pair operation; voltage polarity is recorded. |
| Electrical measurements | Voltage, current and power minima, means and maxima; inrush peak and duration, energy, operating ripple and maintain-power intervals where the required inputs are connected. |
| Signal inspection | Compact VA/IA/VB/IB views with 100 ms, 1 s and 5 s spans. Follow the latest data or focus on an event or cursor. These plots show retained min/max envelopes, not raw scope samples. |
| Phase checks | Measured values beside limits for detection, classification, inrush, port voltage, power and removal. Missing phases or unresolved measurements remain marked rather than inferred. |
| Capture setup | One scope provides the shared sample clock. Each signal uses its own channel; a current input requires the matching voltage input. Observation time and sample rate are configurable. |
Keep the derived data alongside the run record.
Export the run summary and individual checks, including measured values, limits and reasons for measurements that could not be made.
Save and reopen the recorded run with traces and input conversions. Imported runs remain read-only and support the same signal-window, cursor and event-selection controls.
Keep channel bindings, input scaling and observation settings for repeat measurements. The Tap wiring view is also available when reviewing an imported run.
Analysis is included in the shared software. Software, firmware and gateware are open source; no decoder licence or feature unlock is required.