Interpret register values
Compare integer, floating-point and byte-order interpretations. Save names, scale, offset, units and limits as tags.
Control Hub bench
Reconstruct register values from the requests and replies already on the bus. Inspect named values, trends and transaction timing without polling devices or writing registers.
Logic analyser capture with decoded transactions and saved records.
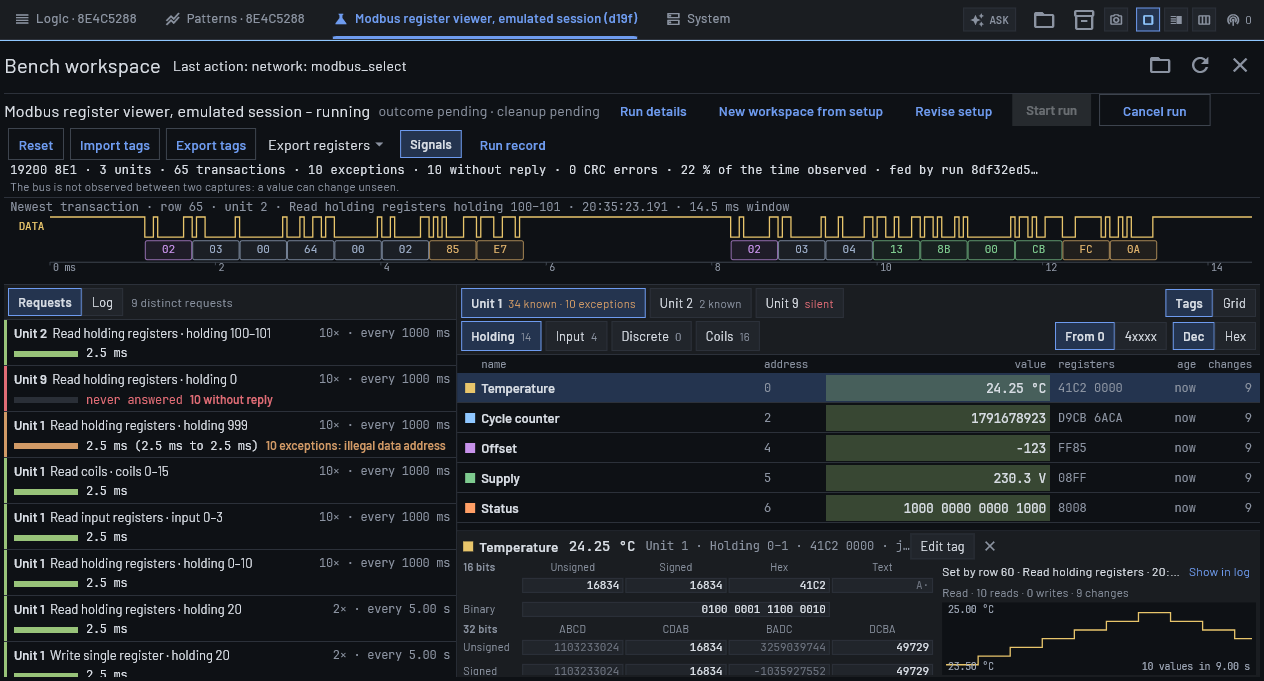 Control Hub · Emulated Modbus RTU session
Register maps, typed values, reply latency and exception logs from captured Modbus RTU traffic.
Compare integer, floating-point and byte-order interpretations. Save names, scale, offset, units and limits as tags.
See which ranges the master requests, observed polling intervals and reply latency. Identify exception responses and requests with no observed reply.
Select a register or tag to see its recorded changes and the transaction that last set it. Switch between the address grid and named values.
Captured in the application. Select a view to inspect its controls and results.
Actual Control Hub screenshots using emulated instruments.
One logic input for a receiver-level bus signal, or two inputs when request and reply directions are available separately on the same analyser.
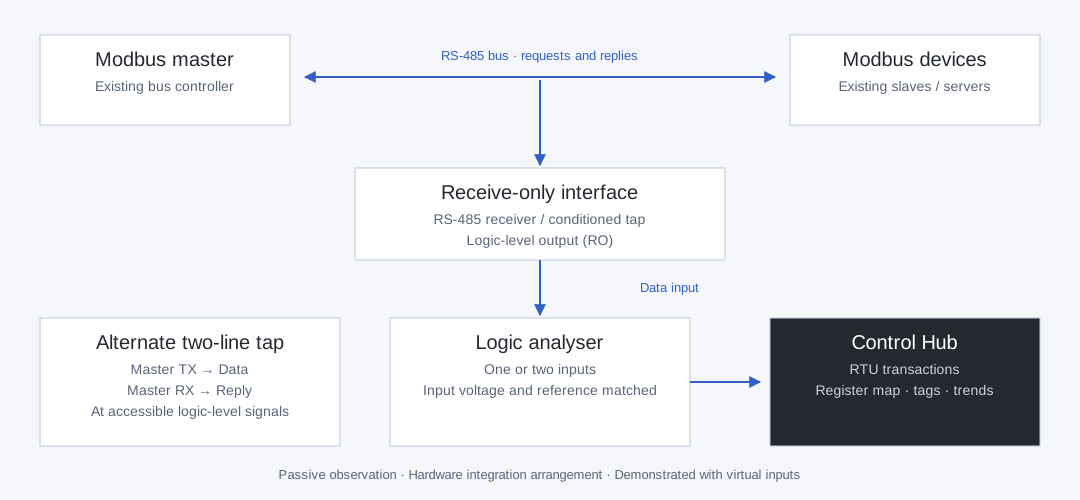
Bind Data to the receiver output carrying both directions. The bench pairs requests and replies within each capture.
Bind Data to master TX and Reply to master RX at accessible logic-level signals. Both inputs must be on the same analyser.
Use an appropriate RS-485 receiver or conditioned tap. The RS-485 differential pair is not a direct logic-input connection; input levels and grounding must match the analyser.
Capture, decode and inspect bus transactions.
| Capability | Implemented software coverage |
|---|---|
| Register tables | Coils, discrete inputs, input registers and holding registers, separated by unit. Protocol addresses or PLC-style notation; decimal or hexadecimal values. |
| Read and write tracking | Reads 1–4, writes 5/6/15/16, mask write 22 and read/write 23 update the map where captured context permits. Writes with an uncaptured reply are marked assumed. |
| Value interpretation | Signed and unsigned 16/32/64-bit integers, 32/64-bit floats, bits, ASCII and booleans. Byte/word order, scale, offset, units, precision and limits. |
| Requests and errors | Request counts, observed periods, reply-latency min/mean/max, named exceptions, CRC and framing errors. An unseen request does not produce a guessed register address. |
| Signal inspection | Request and reply bytes over the captured signal, with unit, function, address, quantity, data and CRC fields. Signals are retained for the latest capture only. |
| Serial settings | Configurable baud, parity and polarity, capture length and response timeout. A baud suggestion can help diagnose traffic that does not decode. |
Keep the derived data alongside the run record.
Export known registers as CSV or JSON. Import and export tag definitions as CSV; tags persist across hub restarts.
Runs retain recorded transaction rows and summaries. The live register map and its history are not included in a saved run; export registers separately.
The map and log continue across runs in the same hub session. Reset or a hub restart clears them. Unknown registers remain unknown until traffic establishes their values.
Analysis is included in the shared software. Software, firmware and gateware are open source; no decoder licence or feature unlock is required.